products

QSMetric™

FDA 510(k) cleared.

QSMetric™ processes gradient echo images of the brain, and when used in combination with other clinical information, aids the qualified physicians in visualizing tissue structures with magnetic susceptibility contrasts and measuring their susceptibility values.

How are clinicians using QSMetric™ in their practices

Our QSMetric™ product is cleared for use under a tool-type indication as stated above. However, physicians are using this product in their clinical practices on a daily basis as supported by studies published in the peer-reviewed medical literature. Here are a few examples of how QSMetric™ is benefiting clinicians and their patients.

Functional iron in the brain

QSM can map iron involved in neuron function, including neurotransmitter generation and oxygen consumption. Deep gray nuclei are highly active in neurotransmitter generation with iron as a cofactor.

Targeting for DBS

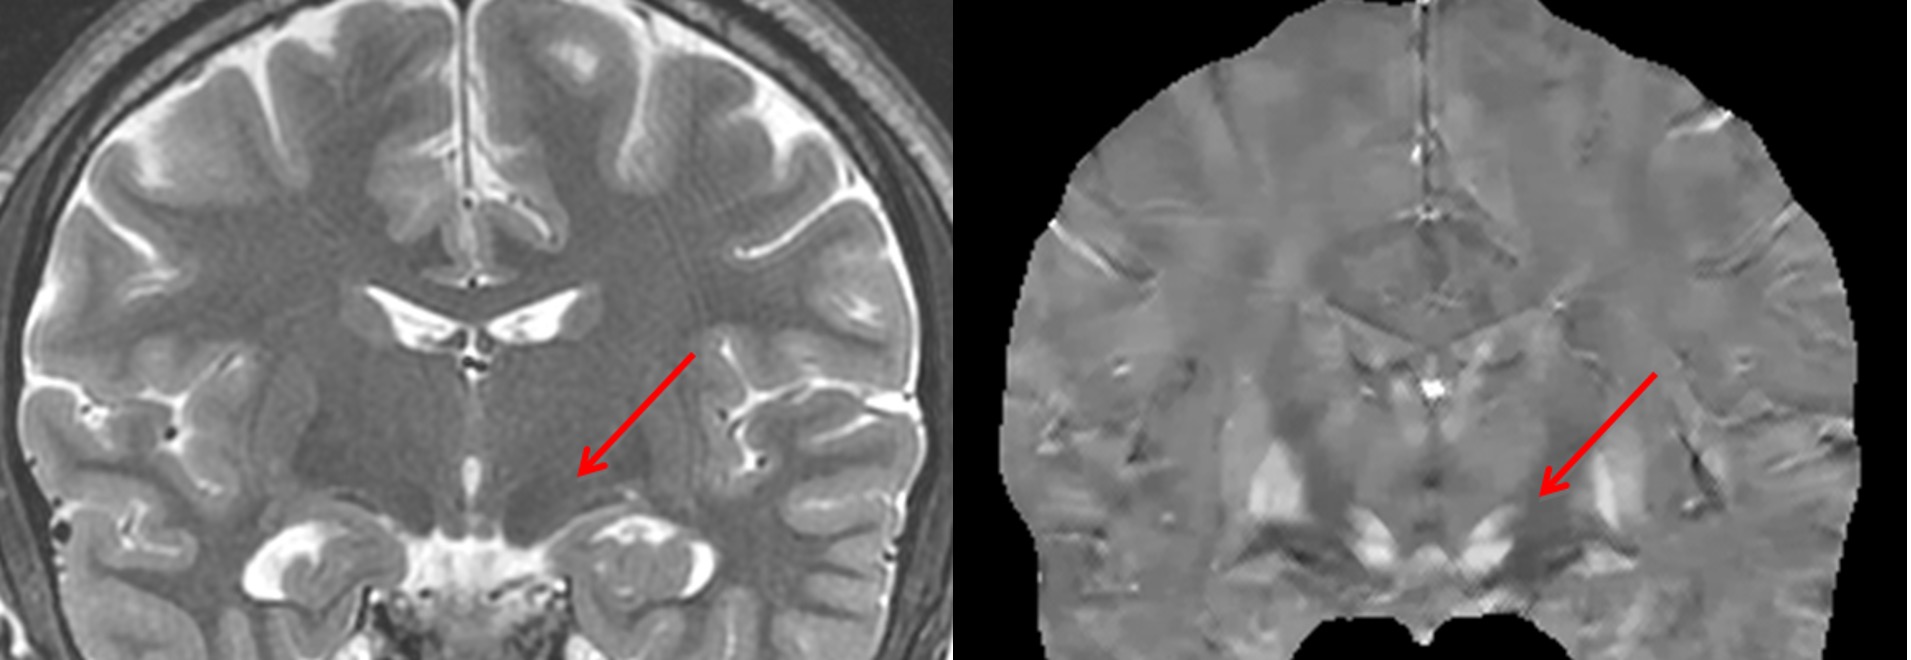
QSM can map iron involved in neuron function, including neurotransmitter generation. Deep gray nuclei are highly active in neurotransmitter generation with iron as a cofactor. Traditional T2 weighted imaging (left) depicts iron-rich deep gray nuclei such as subthalamic nucleus (arrow) with blurred hypointensity. QSM (right) depicts subthalamic nucleus with sharp positive contrast. QSM is the method of choice for mapping DBS targets.

1.
Utilization of Quantitative Susceptibility Mapping for Direct Targeting of the Subthalamic Nucleus During Deep Brain Stimulation Surgery. Rasouli J, et al. Oper Neurosurg (Hagerstown). 2018 Apr 1;14(4):412-419. doi: 10.1093/ons/opx131.PMID: 28531270
2.
Improved subthalamic nucleus depiction with quantitative susceptibility mapping. Liu T, et al. Radiology. 2013. PMID: 23674786

Pathological iron in the brain

Measure hemorrhages, including cerebral cavernous malformation (CCM) and microbleeds. QSM is a quantitative biomarker for monitoring CCM disease activity and response to treatments. Traditional MRI (T2 weighted, below left) does not provide a quantitative measure of bleeding in CCM. QSM (below right) provides a quantitative measure of the total magnetic moment for monitoring the CCM lesion.

1.
Evaluation of iron content in human cerebral cavernous malformation using quantitative susceptibility mapping. Tan H, et al, Invest Radiol. 2014 Jul;49(7):498-504. doi: 10.1097/RLI.0000000000000043.
2.
Quantitative susceptibility mapping as a monitoring biomarker in cerebral cavernous malformations with recent hemorrhage. Zeineddine HA et al, J Magn Reson Imaging. 2018 Apr;47(4):1133-1138.

Differentiate calcifications from hemorrhages

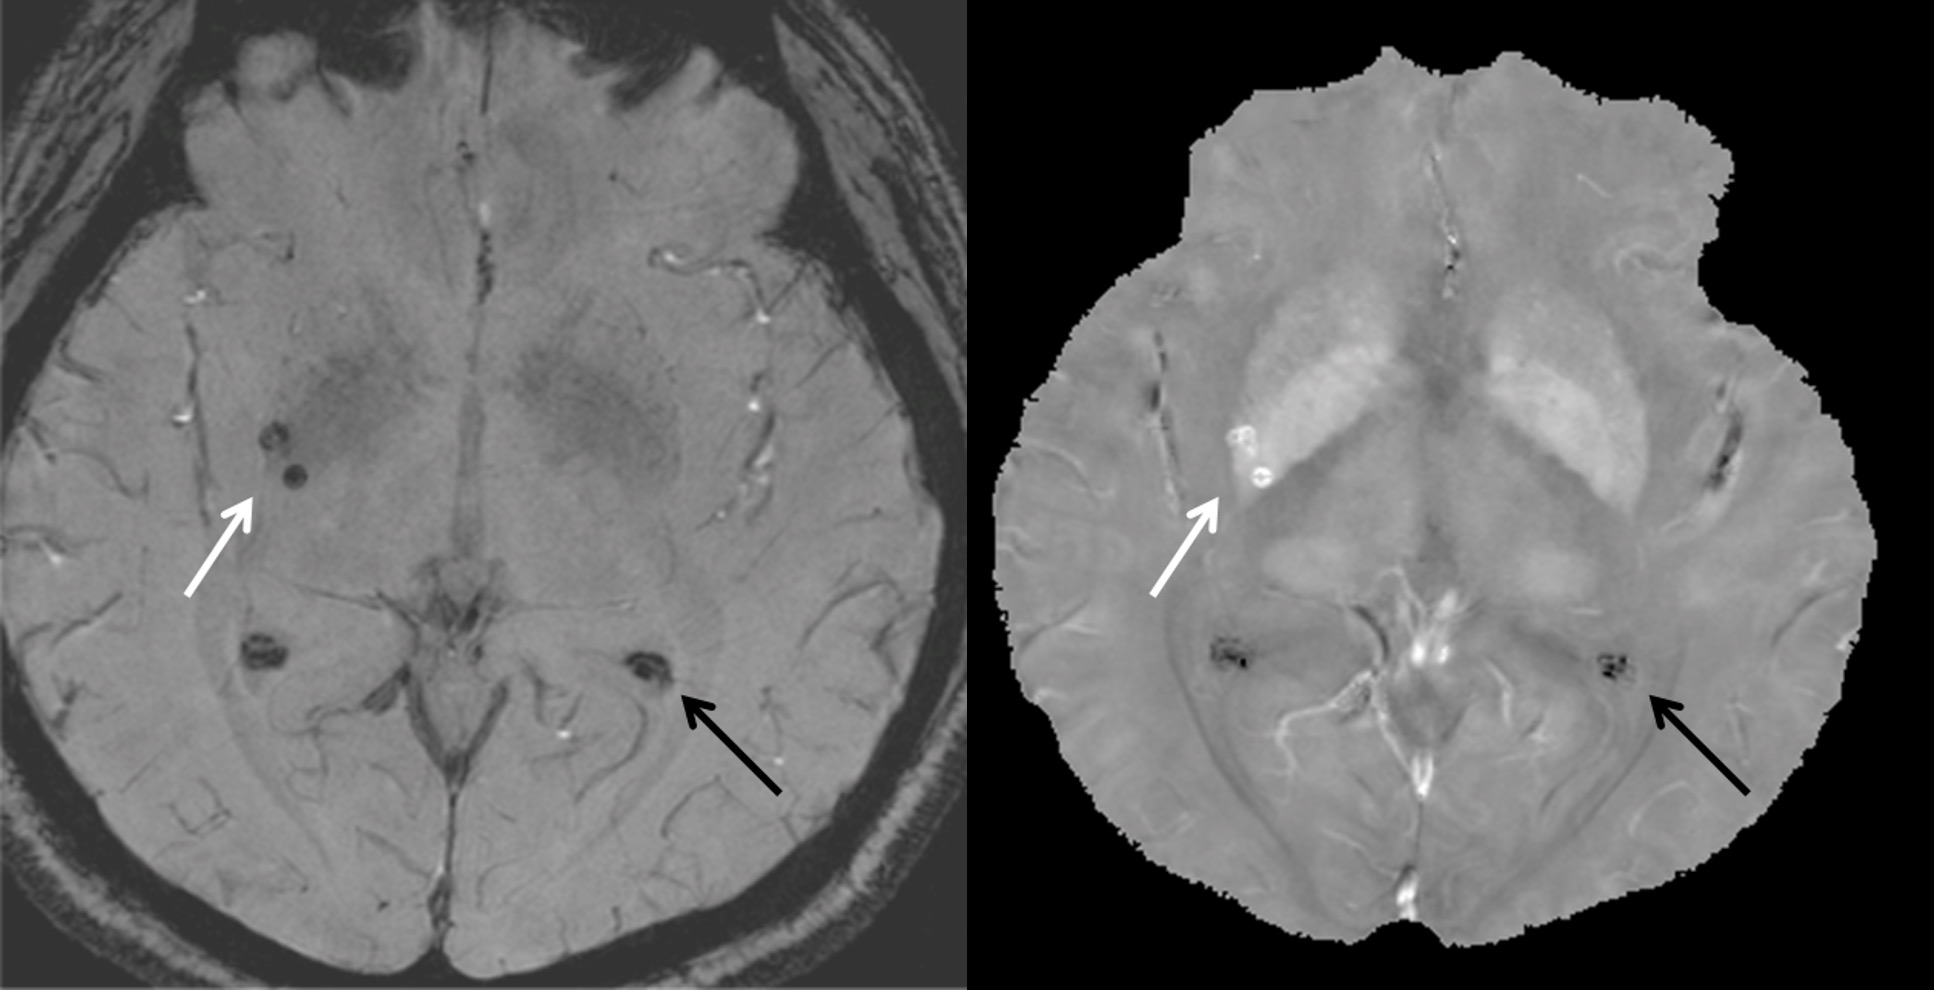
Traditional T2* weighted gradient echo magnitude or susceptibility weighted imaging (SWI) images (left) display both calcifications and hemorrhages with indistinguishable hypointensity. QSM (right) displays calcifications with negative values (dark arrow) and hemorrhages with positive values (white arrow).

1.
Quantitative susceptibility mapping differentiates between blood depositions and calcifications in patients with glioblastoma. Deistung A, at al. PLoS One. 2013;8(3):e57924. PMID: 23555565
2.
Intracranial calcifications and hemorrhages: characterization with quantitative susceptibility mapping. Chen W, et al. Radiology. 2014 Feb;270(2):496-505. PMID: 24126366

Monitor neuroinflammation

1.
Quantitative susceptibility mapping identifies inflammation in a subset of chronic multiple sclerosis lesions. Kaunzner UW, et al. Brain. 2019 Jan 1;142(1):133-145.